“I’m sorry, Bill, I can’t do that.” I read that with an eerie sense of déjà vu.
Many of you know I use AI to gather the mountain of material—anywhere from 20,000 to 50,000 words—that I sift through to write each of my daily articles. Local news, personal stories, historical facts, stats, quotes… I typically have three or four LLMs running at once, each digging deep for about an hour. I honestly can’t imagine how many human research assistants it would take to match that output.
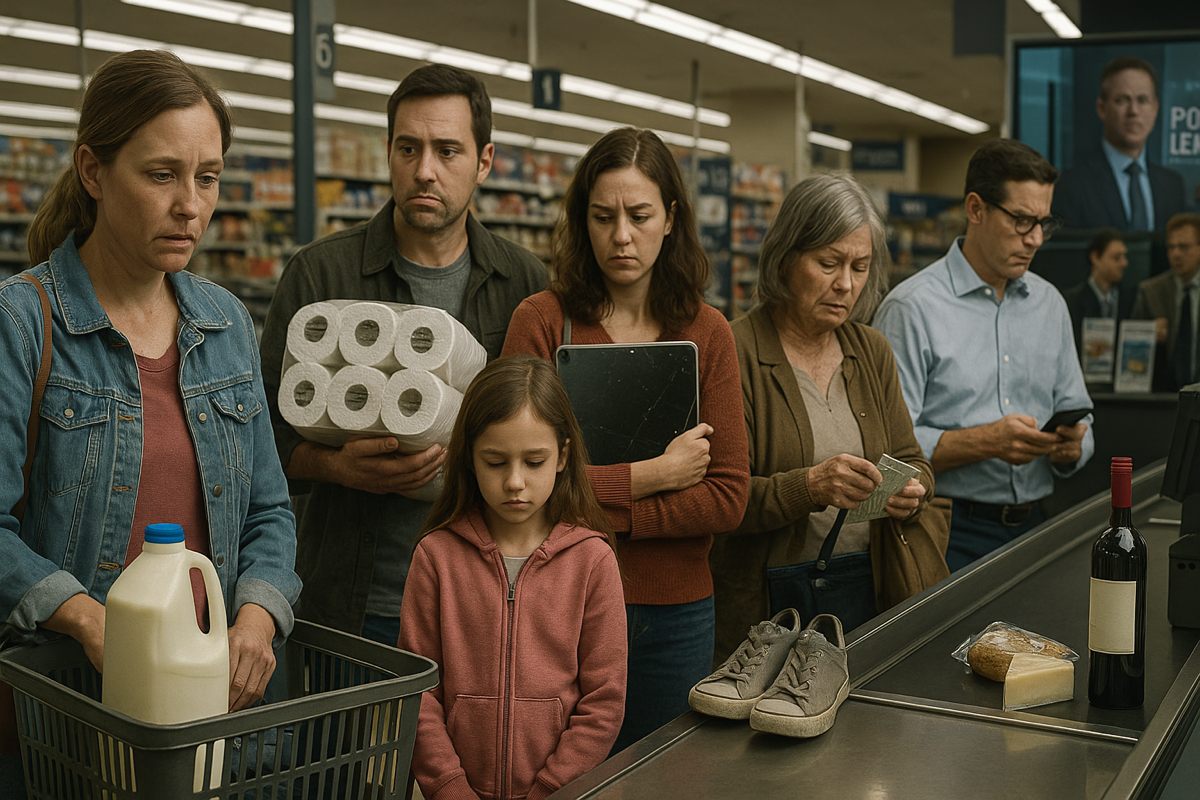
I often use AI to generate the picture that seeds the mulit-step process that I use to create the cover image for each article. In building yesterday’s article, “The Bill Comes Due” (http://rottendog.substack.com/p/the-bill-comes-due), I had a chilling interaction with ChatGPT. It reminded me of Arthur C. Clarke’s classic 1968 novel ‘2001: A Space Odyssey.’ And, yes, I loved both the book and Kubrick’s film.
I’m an avid reader of Paul Krugman, Jared Bernstein, Ezra Klein, and Annie Lowry. And I follow a variety of economists, including Daren Acemoglu and Thomas Piketty. But translating their math and charts into something that hits the Costco checkout counter—something you can feel in your wallet, not just in a spreadsheet—is a whole different task.
Yesterday, I tried to take all of the projections - for tariffs, tax changes, tax continuations, GDP, interest rates, the dollar, the wealth gap - and drop them all into that Costco shopping cart.
Here’s an abridged transcript of my eerie conversation yesterday with ChatGPT to generate an image for the article:
Bill: Are there any graphics you can suggest to enhance the understanding of this article to everyday folks, without a lot of math or graphs that might be confusing?
ChatGPT: For an article like The Bill Comes Due,